Basic Example
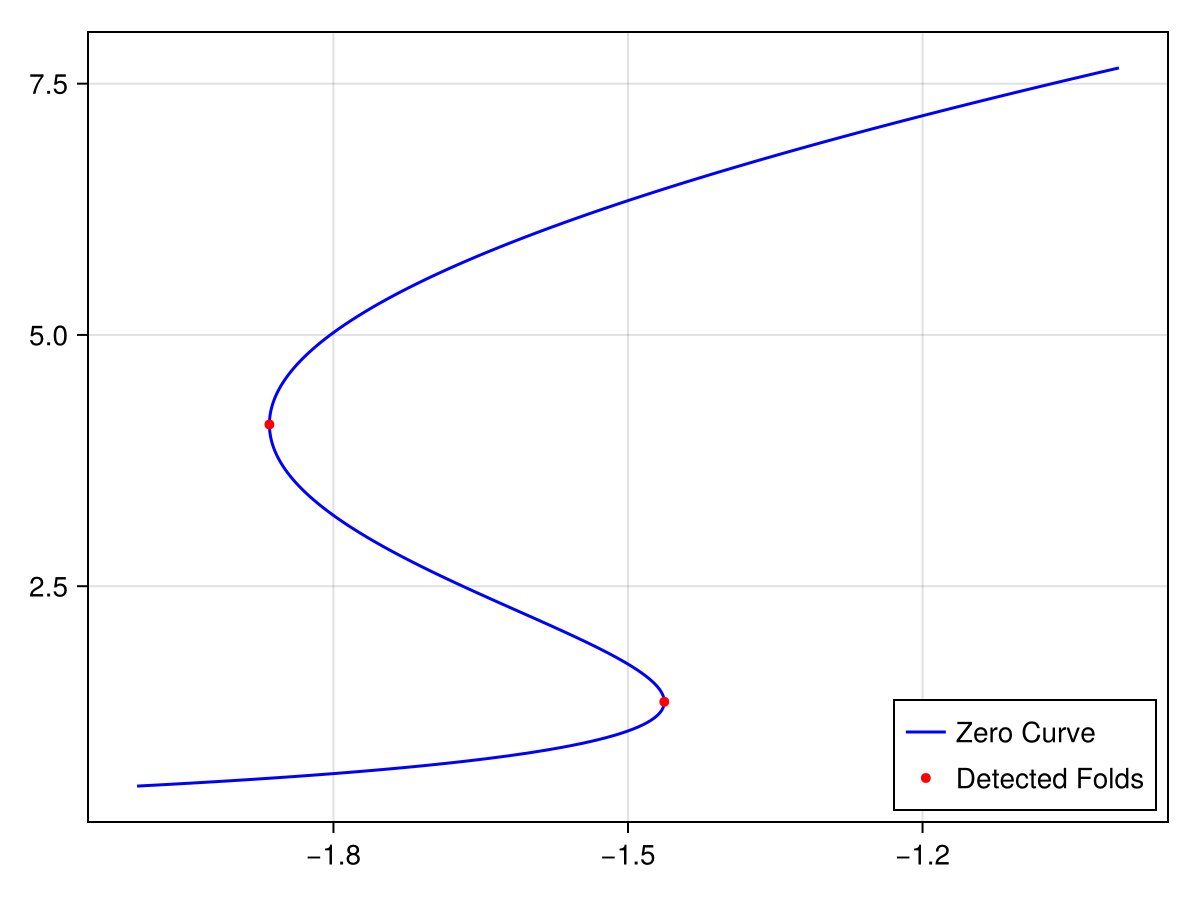
This is a basic example of computing and plotting a continuation curve using PALC.
    using SimpleContinuation
    using DifferentiationInterface
    using Parameters
    using FastClosures

    using ForwardDiff: ForwardDiff
    using CairoMakie

    function TMvf(F, z, E0)
        par_tm = (α=1.5, τ=0.013, J=3.07, E0=-2.0, τD=0.200, U0=0.3, τF=1.5, τS=0.007)
        @unpack J, α, τ, τD, τF, U0 = par_tm
        E, x, u = z
        SS0 = J * u * x * E + E0
        SS1 = α * log(1.0 + exp(SS0 / α))
        F[1] = (-E + SS1) / τ
        F[2] = (1.0 - x) / τD - u * x * E
        F[3] = (U0 - u) / τF + U0 * (1.0 - u) * E
        return nothing
    end
    function TMvf(du, zE0)
        n = length(zE0) - 1
        z = view(zE0, 1:n)
        E0 = zE0[end]
        return TMvf(du, z, E0)
    end

    # Utility function
    function fill_vec!(zE0, z, E0)
        zE0[1:3] .= z
        zE0[4] = E0
        return zE0
    end

    # Create Jacobians
    J_cache = prepare_jacobian(TMvf, zeros(3), AutoForwardDiff(), zeros(4))
    zE0 = zeros(4)
    J = @closure (J, F, z, E0) ->
        jacobian!(TMvf, F, J, J_cache, AutoForwardDiff(), fill_vec!(zE0, z, E0))
    Jz(J, F, z, E0) = jacobian!((y, x) -> TMvf(y, x, E0), F, J, AutoForwardDiff(), z)

    # create a termination callback
    cb_term_fun(u, λ) = λ + 1
    cb_term = TerminateContinuationCallback(cb_term_fun)

    # Form Problem
    cont_prob = ContinuationProblem(
        ContinuationFunction{Val{true}}(TMvf, Jz, J),
        [0.238616, 0.982747, 0.367876], # u0
        -2.0, # λ0
        (-4.0, -0.9), #(λmin, λmax)
    )

    # perform continuation
    cache = continuation(
        cont_prob,
        PALC(; inner_prod=BifurcationKitInnerProduct());
        initial_tangent=SecantInitialTangent(),
        detection_callback = FoldBifurcationDetectionCallback(),
        term_callback = cb_term,
        dsmax=0.01,
    )

    # plot result
    fig = Figure()
    ax = Axis(fig[1, 1])

    λs = map(i -> cache.br[i][2], 1:length(cache.br))
    Es = map(i -> cache.br[i][1][1], 1:length(cache.br))
    λs_det = map(i->cache.detected_points[i][2], 1:length(cache.detected_points))
    Es_det = map(i -> cache.detected_points[i][1][1], 1:length(cache.detected_points))
    lines!(ax, λs, Es; color=:blue, label="Zero Curve")
    scatter!(ax, λs_det, Es_det; color=:red, markersize=7, label="Detected Folds")
    axislegend(ax;position=:rb)
    fig